
jitr quickstart: fitting an optical potential to \(\alpha\) + \(^{44}\)Ca elastic scattering at 29 MeV
jitr solves the scattering problem for a given nucleus-nucleus interaction. In this first example we
set up a reaction and its kinematics
compile a solver for it
define a parametric optical potential and calculate an elastic differential cross section
fit the potential parameters to experimental data
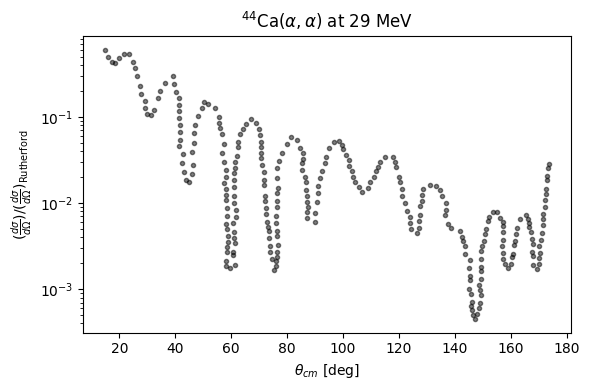
The data come from EXFOR F0567 (Oeschler et al., 1972). We will look at the example of of the \(\alpha\)-elastic scattering on \(^{44}\)Ca, fitting an optical potential to differential elastic scattering cross sections (as a ratio to the Rutherford scattering cross section).
A subsequent demo, alpha_ca_calibration.ipynb does a full Bayesian calibration with a simple error model learned from the data.
1import numpy as np
2import pandas as pd
3from matplotlib import pyplot as plt
Set up the reaction
A Reaction holds the target, projectile and process. Its kinematics method turns a lab energy into the quantities the solver needs: the center-of-mass energy, the wavenumber \(k\), the reduced mass, \(\mu\), and the Sommerfeld parameter \(\eta\).
1from jitr.reactions.reaction import Reaction
2
3reaction = Reaction(target=(44, 20), projectile=(4, 2), process="El")
4energy_lab = 29  # MeV
5kinematics = reaction.kinematics(energy_lab)
6print(reaction)
7print(
8    f"Ecm: {kinematics.Ecm:1.2f} [MeV]\nk: {kinematics.k:1.2f} [fm^-1]\nmu: {kinematics.mu:1.2f}\neta: {kinematics.eta:1.2f}"
9)
44-Ca(alpha,el)
Ecm: 26.58 [MeV]
k: 2.16 [fm^-1]
mu: 3437.68
eta: 2.35
Read in the data
 1df = pd.read_csv("./alpha_ca_ratio_ruth.csv")
 2df = df[df["target"] == "Ca44"]
 3angles_deg = df["angle_cm_deg"].to_numpy()
 4y_data = df["ratio_to_rutherford"].to_numpy()
 5print(
 6    f"{len(y_data)} data points between {angles_deg.min():.0f} and {angles_deg.max():.0f} degrees"
 7)
 8
 9
10def plot_data(ax, y_err=None):
11    if y_err is not None:
12        ax.errorbar(
13            angles_deg,
14            y_data,
15            y_err,
16            marker=".",
17            linestyle="none",
18            color="k",
19            alpha=0.5,
20            label="data",
21        )
22    else:
23        ax.plot(angles_deg, y_data, ".", color="k", alpha=0.5, label="data")
24    ax.set_yscale("log")
25    ax.set_xlabel(r"$\theta_{cm}$ [deg]")
26    ax.set_ylabel(
27        r"$(\frac{d\sigma}{d\Omega}) / (\frac{d\sigma}{d\Omega})_\text{Rutherford}$"
28    )
29    ax.set_title(r"$^{44}$Ca($\alpha,\alpha$) at 29 MeV")
30
31
32fig, ax = plt.subplots(figsize=(6, 4))
33plot_data(ax)
34plt.tight_layout()
35plt.show()
289 data points between 15 and 174 degrees
Compile the solver
jitr uses the \(\mathcal{R}\)-matrix method on a Lagrange-Legendre mesh following Descouvemont, 2016. The solver needs a channel radius (beyond which the nuclear potential is negligible and the wavefunction is matched to Coulomb functions), a number of basis functions \(N\), and a maximum partial wave \(\ell_\text{max}\). The helpers below give rules of thumb for the first two. For the rather sharp-edged \(\alpha\) potentials used here, the default number of nodes is not quite converged at backward angles, so we ask for 8 nodes per half-wavelength (see convergence_channel_radius.ipynb for how to check this yourself).
The DifferentialWorkspace precomputes everything that does not depend on the potential for a fixed set of angles - here the angles of the data. Building it compiles code and takes a few seconds. Once it is compiled, it is fast to pass in an interaction and get back a cross section.
 1from jitr.rmatrix import Solver
 2from jitr.utils import utils
 3from jitr.xs import elastic
 4
 5interaction_range_fm = (
 6    1.2 * (reaction.target.A ** (1 / 3) + reaction.projectile.A ** (1 / 3)) + 2
 7)
 8channel_radius_dimensionless = utils.suggested_dimensionless_channel_radius(
 9    interaction_range_fm, kinematics.k
10)
11channel_radius_fm = channel_radius_dimensionless / kinematics.k
12N = utils.suggested_basis_size(channel_radius_dimensionless, zeros_per_node=8)
13lmax = 60
14print(
15    f"channel radius: {channel_radius_fm:.2f} [fm]\nSystem size per symmetry block {N}x{N}\nMax partial wave: {lmax}"
16)
17
18workspace = elastic.DifferentialWorkspace.build_from_system(
19    reaction=reaction,
20    kinematics=kinematics,
21    channel_radius_fm=channel_radius_fm,
22    solver=Solver(N),
23    lmax=lmax,
24    angles=np.deg2rad(angles_deg),
25)
channel radius: 11.05 [fm]
System size per symmetry block 64x64
Max partial wave: 60
Define the interaction
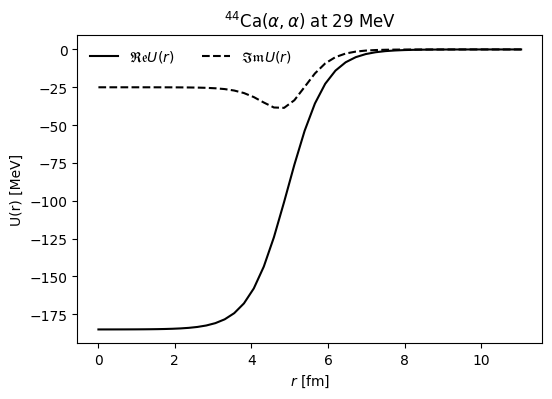
The potential is a function radial coordinate – the magnitude of the distance between the projectile and target center of mass – that we evaluate on the workspace’s quadrature grid. We use a real volume Woods-Saxon shaped potential, an imaginary volume and an imaginary surface term, and the Coulomb potential of a uniformly charged sphere. Seven parameters are free: the depths \(V\), \(W_v\), \(W_s\) and the geometry \(r_v, a_v, r_w, a_w\) (radii in units of \(A^{1/3}\) fm; the surface term shares the imaginary geometry). workspace.xs returns the differential cross section; dividing by workspace.rutherford gives the observable in the data.
The parameteric Woods-Saxon shape is
the surface-peaked shape is just the derivative of this with respect to \(r\).
 1from jitr.optical_potentials.potential_forms import (
 2    coulomb_charged_sphere as coulomb,
 3)
 4from jitr.optical_potentials.potential_forms import (
 5    woods_saxon_prime_safe as wsp,
 6)
 7from jitr.optical_potentials.potential_forms import (
 8    woods_saxon_safe as ws,
 9)
10
11
12def U_central(r, Vv, Wv, Ws, Rv, av, Rw, aw):
13    return (
14        -Vv * ws(r, Rv, av)
15        - 1j * Wv * ws(r, Rw, aw)
16        - 1j * Ws * (-4 * aw) * wsp(r, Rw, aw)
17    )
18
19
20rgrid = workspace.radial_grid()
21A_factor = reaction.target.A ** (1 / 3)
22Zz = reaction.target.Z * reaction.projectile.Z
23coulomb_potential = coulomb(rgrid, Zz, 1.3 * A_factor)
24
25
26def calculate_xs_ratio(theta):
27    """Ratio to Rutherford at the data angles for optical model parameters theta."""
28    Vv, Wv, Ws, rv, av, rw, aw = theta
29    central_potential = U_central(
30        rgrid, Vv, Wv, Ws, rv * A_factor, av, rw * A_factor, aw
31    )
32    xs = workspace.xs(
33        central_potential=central_potential, coulomb_potential=coulomb_potential
34    )
35    return xs.dsdo / workspace.rutherford
36
37
38names = ["Vv", "Wv", "Ws", "rv", "av", "rw", "aw"]
A typical \(\alpha\)-nucleus potential at these energies has \(V \approx 185\) MeV, \(r_v \approx 1.4\) fm, \(a \approx 0.5\) fm and \(W \approx 25\) MeV.
 1theta_0 = np.array([185, 25, 25, 1.4, 0.5, 1.4, 0.4])
 2
 3
 4def plot_potential(theta, ax):
 5    Vv, Wv, Ws, rv, av, rw, aw = theta
 6    U = U_central(rgrid, Vv, Wv, Ws, rv * A_factor, av, rw * A_factor, aw)
 7    ax.plot(rgrid, U.real, "k", label=r"$\mathfrak{Re} U(r)$")
 8    ax.plot(rgrid, U.imag, "--k", label=r"$\mathfrak{Im} U(r)$")
 9    ax.legend(ncol=2, framealpha=0)
10    ax.set_xlabel(r"$r$ [fm]")
11    ax.set_ylabel(r"U(r) [MeV]")
12    ax.set_title(r"$^{44}$Ca($\alpha,\alpha$) at 29 MeV")
13
14
15fig, ax = plt.subplots(figsize=(6, 4))
16plot_potential(theta_0, ax)
Let’s see how that does.
1fig, ax = plt.subplots(figsize=(6, 4))
2plot_data(ax)
3ax.plot(angles_deg, calculate_xs_ratio(theta_0), color="#3366CC", label=r"$\theta_0$")
4ax.legend(framealpha=0)
5plt.tight_layout()
6plt.show()
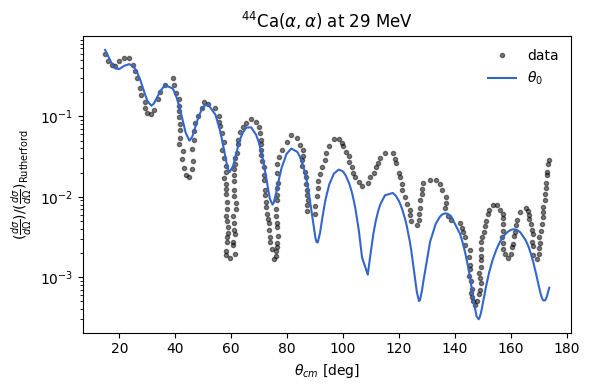
Not a bad start.
Fit the potential to the data
The paper gives no uncertainties, so we have to assume something. The simplest reasonable choice is an unknown relative error on every point, \(\sigma_i = \beta\, y_i^{\text{pred}}\), with the same fraction \(\beta\) everywhere.
We will use scipy.optimize.least_squares for fitting, to find the parameters \(\alpha\) that minimize the \(\chi^2\):
The minimum of this function is \(\beta\)-independent, so this does not require making any assumptions other than that the error is relative.
 1%%time
 2from scipy.optimize import least_squares
 3
 4theta_bounds = np.array(
 5    [[120, 250], [0, 60], [0, 60], [1.15, 1.6], [0.4, 0.8], [1.0, 1.8], [0.2, 0.9]]
 6)
 7
 8
 9def relative_residuals(theta):
10    y_pred = calculate_xs_ratio(theta)
11    return (y_data - y_pred) / y_pred
12
13
14fit = least_squares(relative_residuals, theta_0, bounds=theta_bounds.T, x_scale="jac")
15theta_mle = fit.x
16error_fraction = np.sqrt(np.mean(fit.fun**2))
17print(f"converged: {fit.success} after {fit.nfev} evaluations")
18print(f"inferred relative error: {100 * error_fraction:.0f}%")
converged: True after 32 evaluations
inferred relative error: 53%
CPU times: user 24 s, sys: 11.7 ms, total: 24 s
Wall time: 3.1 s
1pd.DataFrame({"start": theta_0, "fit": theta_mle}, index=names).T.round(3)
| Vv | Wv | Ws | rv | av | rw | aw | |
|---|---|---|---|---|---|---|---|
| start | 185.000 | 25.000 | 25.000 | 1.400 | 0.500 | 1.400 | 0.400 |
| fit | 215.744 | 21.822 | 0.104 | 1.315 | 0.577 | 1.694 | 0.332 |
 1fig, ax = plt.subplots(figsize=(6, 4))
 2plot_data(ax, y_err=0.1 * y_data)
 3ax.plot(
 4    angles_deg,
 5    calculate_xs_ratio(theta_0),
 6    color="#3366CC",
 7    alpha=0.4,
 8    label=r"$\theta_0$",
 9)
10ax.plot(
11    angles_deg,
12    calculate_xs_ratio(theta_mle),
13    color="#3366CC",
14    linewidth=2,
15    label="maximum likelihood",
16)
17ax.legend(framealpha=0)
18plt.tight_layout()
19plt.show()
What did we learn?
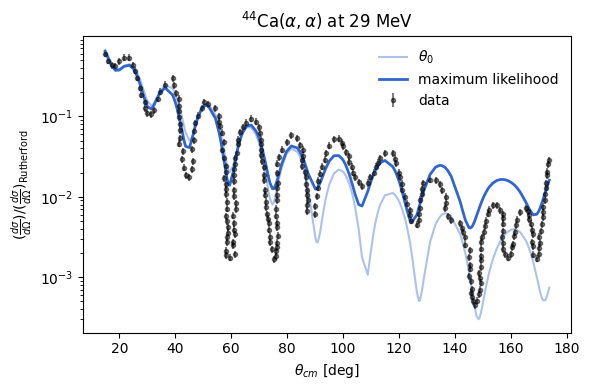
The fit roughly reproduces the angular spacing of diffraction pattern as well as the general rate at which the ratio decreases with angle (which tells us something about the amplitude for non-elastic processes), but the depth of each of the dips is poorly reproduced after about 20-30\(^\circ\).
To make matters worse, light ion-nucleus potentials are famously ambiguous - several distinct families of parameters, differing in \(V\) by tens of MeV, give nearly the same cross section. Where the optimizer lands depends on where it starts.
Finally, we have said nothing about the uncertainty of our predictions. Surely, with a best fit line that does not pass through all of our data, we would expect the corresponding uncertainty in the inferred parameters to actually be large.
The subsequent notebook, alpha_ca_calibration.ipynb does a full Bayesian calibration in which the scales of the errors are learned from the data alongside the potential, and checks the result against the data.