
Uncertainty quantification of partial wave transmission coefficients
This notebook extends the uncertainty-propagation workflow to angular reaction observables. It shows how the same model choices that affect transmission coefficients flow through to angle-dependent reaction outputs.
1import numpy as np
2from IPython.display import Math, display
3from periodictable import elements
1from matplotlib import pyplot as plt
Compare mass-model inputs to Koning-Delaroche
1A, Z = (24, 12)
1name_core = str(elements[Z].symbol)
2display(Math(f"^{{{A}}} \\rm{{{name_core}}}"))
\[\displaystyle ^{24} \rm{Mg}\]
Compute transmission coefficients
Let’s use jitr to calculate UQ’ed transmission coefficients using KDUQ Fermi energies and those from a variety of mass models
1from tqdm import tqdm
2
3import jitr
1neutron = (1, 0)
2proton = (1, 1)
3projectile = proton
4target = (A, Z)
1# we have 416 samples from the KDUQ posterior
2kduq_omp_samples = jitr.optical_potentials.kduq.get_samples(proton)
1# com_energy_grid = np.logspace(-1, 1.3, 100)
2lab_energy_grid = np.array([65, 200])
3range_fm = 15
4lmax = 20
1reaction = jitr.reactions.Reaction(target=target, projectile=projectile, process="EL")
 1def set_up_grid(core, lab_energy_grid):
 2    solvers = []
 3    for _i, Elab in enumerate(tqdm(lab_energy_grid)):
 4        kinematics = reaction.kinematics(Elab)
 5        a = range_fm * kinematics.k + np.pi / 2
 6        N = jitr.utils.suggested_basis_size(a)
 7        solvers.append(
 8            jitr.xs.elastic.IntegralWorkspace(
 9                reaction=reaction,
10                kinematics=kinematics,
11                channel_radius_fm=a / kinematics.k,
12                solver=jitr.rmatrix.Solver(N),
13                lmax=lmax,
14                smatrix_abs_tol=0,
15            )
16        )
17    return solvers
1solvers = set_up_grid(target, lab_energy_grid)
100%|██████████| 2/2 [00:10<00:00, 5.11s/it]
Run the uncertainty propagation
KDUQ
 1tcoeff_kduq = np.zeros((lab_energy_grid.size, kduq_omp_samples.shape[0], 2, lmax + 1))
 2for j, sample in enumerate(tqdm(kduq_omp_samples)):
 3    for i, _Elab in enumerate(lab_energy_grid):
 4        rgrid = solvers[i].radial_grid()
 5        central_params, spin_orbit_params, coulomb_params = (
 6            jitr.optical_potentials.kduq.calculate_params(
 7                projectile,
 8                target,
 9                solvers[i].kinematics.Elab,
10                *sample,
11            )
12        )
13
14        tplus, tminus = solvers[i].transmission_coefficients(
15            jitr.optical_potentials.kduq.central(rgrid, *central_params),
16            jitr.optical_potentials.kduq.spin_orbit(rgrid, *spin_orbit_params),
17            jitr.optical_potentials.kduq.coulomb_charged_sphere(rgrid, *coulomb_params),
18        )
19        tcoeff_kduq[i, j, 0, :] = tplus
20        tcoeff_kduq[i, j, 1, :] = tminus
 96%|█████████▋| 401/416 [00:19<00:00, 33.49it/s]/home/kyle/umich/jitr/src/jitr/optical_potentials/kduq.py:470: RuntimeWarning: overflow encountered in exp
  d2 = d2_0 + d2_A / (1 + np.exp((A - d2_A3) / d2_A2))
100%|██████████| 416/416 [00:19<00:00, 21.27it/s]
 1data = [np.zeros(lmax + 1)] * 8
 2names = [
 3    "E=65 MeV, j = l + 1/2",
 4    "E=65 MeV, j = l - 1/2",
 5    "E=65 MeV, j = l + 1/2, err",
 6    "E=65 MeV, j = l - 1/2, err",
 7    "E=200 MeV, j = l + 1/2",
 8    "E=200 MeV, j = l - 1/2",
 9    "E=200 MeV, j = l + 1/2, err",
10    "E=200 MeV, j = l - 1/2, err",
11]
1from pandas import DataFrame as df
1data = df.from_dict(dict(zip(names, data, strict=False)))
1plus_color = "tab:blue"
2minus_color = "tab:orange"
1ci_plus = np.percentile(tcoeff_kduq[0, :, 0, :], 50, axis=0)
2ci_plus_errs = np.percentile(tcoeff_kduq[0, :, 0, :], 84, axis=0) - np.percentile(
3    tcoeff_kduq[0, :, 0, :], 16, axis=0
4)
1ci_minus = np.percentile(tcoeff_kduq[0, :, 1, :], 50, axis=0)
2ci_minus_errs = np.percentile(tcoeff_kduq[0, :, 1, :], 84, axis=0) - np.percentile(
3    tcoeff_kduq[0, :, 1, :], 16, axis=0
4)
1ci_minus[0] = None
2ci_minus_errs[0] = None
1data["E=65 MeV, j = l + 1/2"] = ci_plus
2data["E=65 MeV, j = l + 1/2, err"] = ci_plus_errs
3data["E=65 MeV, j = l - 1/2"] = ci_minus
4data["E=65 MeV, j = l - 1/2, err"] = ci_minus_errs
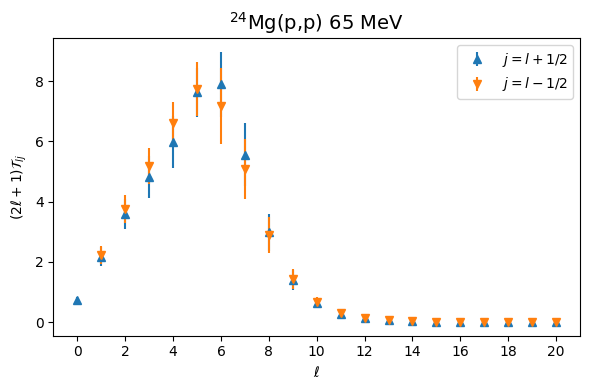
 1fig = plt.figure(figsize=(6, 4))
 2ls = np.arange(lmax + 1)
 3plt.errorbar(
 4    ls,
 5    ci_plus * (2 * ls + 1),
 6    ci_plus_errs * (2 * ls + 1),
 7    linestyle="none",
 8    marker="^",
 9    label="$j = l + 1/2$",
10)
11
12plt.errorbar(
13    ls[1:],
14    ci_minus[1:] * (2 * ls[1:] + 1),
15    ci_minus_errs[1:] * (2 * ls[1:] + 1),
16    linestyle="none",
17    marker="v",
18    label="$j = l - 1/2$",
19)
20
21# plt.yscale("log")
22plt.xticks([0, 2, 4, 6, 8, 10, 12, 14, 16, 18, 20])
23plt.xlabel(r"$\ell$")
24plt.ylabel(r"$(2  \ell +1) \mathcal{T}_{lj}$")
25plt.title(r"$^{24}$Mg(p,p) 65 MeV", fontsize=14)
26plt.legend()
27plt.tight_layout()
1ci_plus = np.percentile(tcoeff_kduq[1, :, 0, :], 50, axis=0)
2ci_plus_errs = np.percentile(tcoeff_kduq[1, :, 0, :], 84, axis=0) - np.percentile(
3    tcoeff_kduq[1, :, 0, :], 16, axis=0
4)
1ci_minus = np.percentile(tcoeff_kduq[1, :, 1, :], 50, axis=0)
2ci_minus_errs = np.percentile(tcoeff_kduq[1, :, 1, :], 84, axis=0) - np.percentile(
3    tcoeff_kduq[1, :, 1, :], 16, axis=0
4)
5ci_minus[0] = None
6ci_minus_errs[0] = None
1data["E=200 MeV, j = l + 1/2"] = ci_plus
2data["E=200 MeV, j = l + 1/2, err"] = ci_plus_errs
3data["E=200 MeV, j = l - 1/2"] = ci_minus
4data["E=200 MeV, j = l - 1/2, err"] = ci_minus_errs
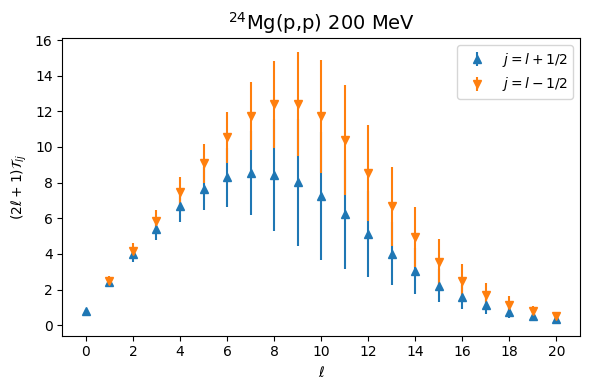
 1fig = plt.figure(figsize=(6, 4))
 2plt.errorbar(
 3    ls,
 4    ci_plus * (2 * ls + 1),
 5    ci_plus_errs * (2 * ls + 1),
 6    linestyle="none",
 7    marker="^",
 8    label="$j = l + 1/2$",
 9)
10
11plt.errorbar(
12    ls[1:],
13    ci_minus[1:] * (2 * ls[1:] + 1),
14    ci_minus_errs[1:] * (2 * ls[1:] + 1),
15    linestyle="none",
16    marker="v",
17    label="$j = l - 1/2$",
18)
19
20# plt.yscale("log")
21plt.xticks([0, 2, 4, 6, 8, 10, 12, 14, 16, 18, 20])
22plt.xlabel(r"$\ell$")
23plt.ylabel(r"$(2  \ell +1) \mathcal{T}_{lj}$")
24plt.title(r"$^{24}$Mg(p,p) 200 MeV", fontsize=14)
25plt.legend()
26plt.tight_layout()
1# NBVAL_CHECK_OUTPUT
2data.head()
| E=65 MeV, j = l + 1/2 | E=65 MeV, j = l - 1/2 | E=65 MeV, j = l + 1/2, err | E=65 MeV, j = l - 1/2, err | E=200 MeV, j = l + 1/2 | E=200 MeV, j = l - 1/2 | E=200 MeV, j = l + 1/2, err | E=200 MeV, j = l - 1/2, err | |
|---|---|---|---|---|---|---|---|---|
| 0 | 0.742337 | NaN | 0.102470 | NaN | 0.821403 | NaN | 0.079719 | NaN |
| 1 | 0.724359 | 0.743781 | 0.105309 | 0.100490 | 0.809859 | 0.834128 | 0.082819 | 0.079568 |
| 2 | 0.717748 | 0.750458 | 0.100080 | 0.093144 | 0.794527 | 0.836448 | 0.085787 | 0.082877 |
| 3 | 0.690068 | 0.740712 | 0.099991 | 0.087372 | 0.771663 | 0.836196 | 0.088131 | 0.089072 |
| 4 | 0.666408 | 0.735901 | 0.095884 | 0.075141 | 0.740452 | 0.831666 | 0.099101 | 0.094705 |